
This article was made possible by my amazing patrons! Special thanks in particular go to the following comrades: Alex Wilson, Bert Rothkugel, Chloe Hopkins, Chris Gravell, Konrad, Michael Murray, Mick McAteer, Neil Barton, Patrick Lefevre, Pawel Kaczmarski, Ruth Holliday, Stephen Kaar, Thomas Alexander, Uditha Desilva, Joseph Bailey
Amended 12/09/2023
In addition to the below, my seat model now incorporates a tactical voting adjustment.
2023 polling from Electoral Calculus/Find Out Now suggests that 37% of Labour voters would vote tactically, with 48% of them putting the Lib Dems as their second preference. I thus assign 18% of Labour Party voters (37% x 48% = 18%) to the Lib Dems in Con/Lib Dem marginals. Other than that, my model remains exactly the same as outlined below.
I’ve been asked a few times to explain the model I use to project seat outcomes under Britain’s first-past-the-post electoral system, and in the post-local election political lull, now seems like a perfect time. If you have any questions about how the model works, or want to try it out for yourself, this is the article for you.
First off, here’s a download link for the excel spreadsheet I designed.
BACKGROUND
Up until December 2022, my seat estimates were produced using a slightly modified Uniform National Swing (UNS) model – which is to say, if one party gained 10pts nationally then they rose by 10pts in every constituency. UNS has always had its flaws, but in an aggregate sense it performed reasonably well in 2017 and 2019 when the actual popular vote was inputted into the model, so I felt it was an acceptable model until I developed a better one. In addition, UNS and my current model were actually fairly in sync up until the middle of 2022, as Labour’s lead was relatively small.
However, in the final few months of 2023, the polls shifted dramatically. Labour’s poll lead rose from the high single digits (8-9pts) to a sold double-digit lead, even rising to 20pts or 30pts. These figures were an enormous transformation from the 2019 election, when the Tories had built up sizeable majorities in many seats across the country. Perhaps unsurprisingly, UNS could not process these sizeable changes.
The outcomes it was projecting ceased to be realistic or likely. The model began to project hung parliaments even with Labour leads of 11-12pts, an entirely unrealistic outcome given that both major parties have won landslide victories with even smaller leads in the popular vote. It was clear to me that I had to adopt a new model, so I turned to the experts in the matter: Electoral Calculus, who have been working in this area for decades.
After thorough research and testing, I settled on a slightly tweaked version of Electoral Calculus’s Strong Transition Model. Electoral Calculus used this projection model until adopting Multilevel regression with poststratification (MRP). Their Strong Transition model is also the type of projection system used by Britain Elects, another expert whose opinion on elections I value greatly. It is this model I will explain in this article.
PART 1: THE TRANSITION MODEL
The starting premise of the ‘transition model’ (the core of the model) is that a party’s vote share does not go up or down by the same amount in every single constituency. Rather, the swing is proportional – bigger or smaller depending on how much support each party had last time.
Consider the case study of Liverpool Walton. In 2019, Labour won 85% of the vote in Liverpool Walton.
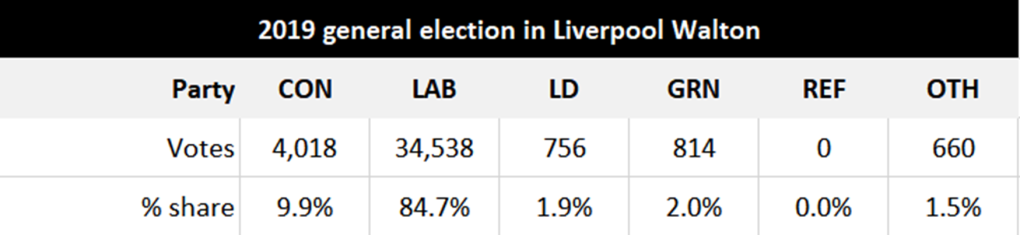
Since that election, the party has increased its national vote share from 32.9% to 44% (+11.1pts). Uniform swing would suggest that the party will win 96% of the vote in Walton. That won’t happen. Rather, it will see its vote increase only marginally, for two reasons:
- Labour already has a sizeable share of support in that seat;
- The vote share for parties who have lost support was already very low.
To calculate the likely vote share in Walton in 2024, therefore, we use the following formula.
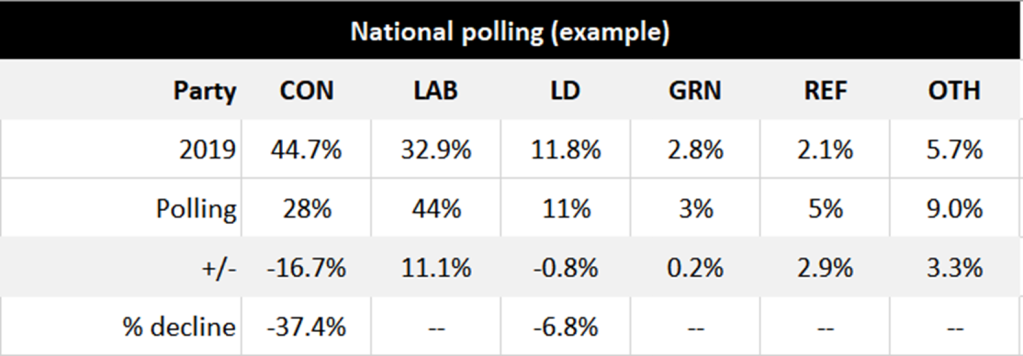
- First, we look at which parties have lost support nationally. At present, on average, only the Conservatives (-16.7pts) and Lib Dems (-0.8pts) have lost votes. But instead of applying this decline evenly across all seats, we instead calculate the proportional decline.
- So we then apply this decline proportionally to Walton. This results in the Tory vote being reduced by 37.4% (-1,501 votes) and the LD vote being reduced by 6.8% (-51 votes).
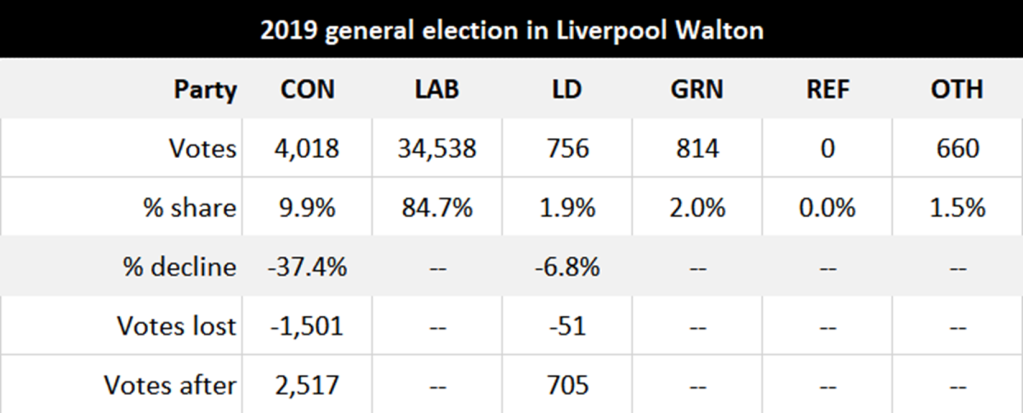
- This leaves 1,501 ex-Tory and 51 ex-LD voters who will be re-allocated to a new party.
- To decide how these voters are distributed, we’ll look at the parties who have gained nationally. In this example poll, it’s Lab +11pts, Grn +2pts, Ref +3pts, Others +1pts.
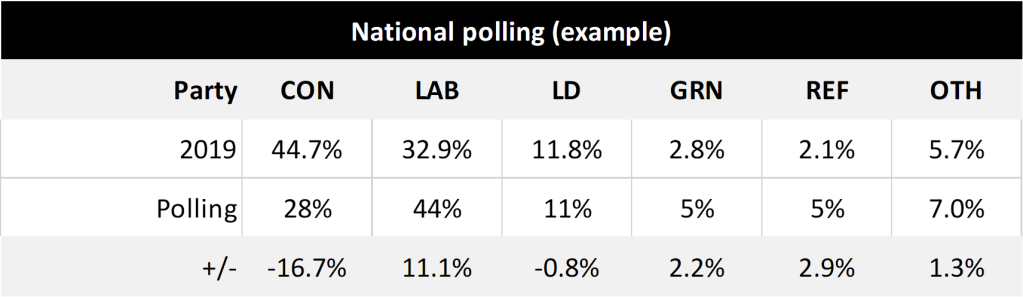
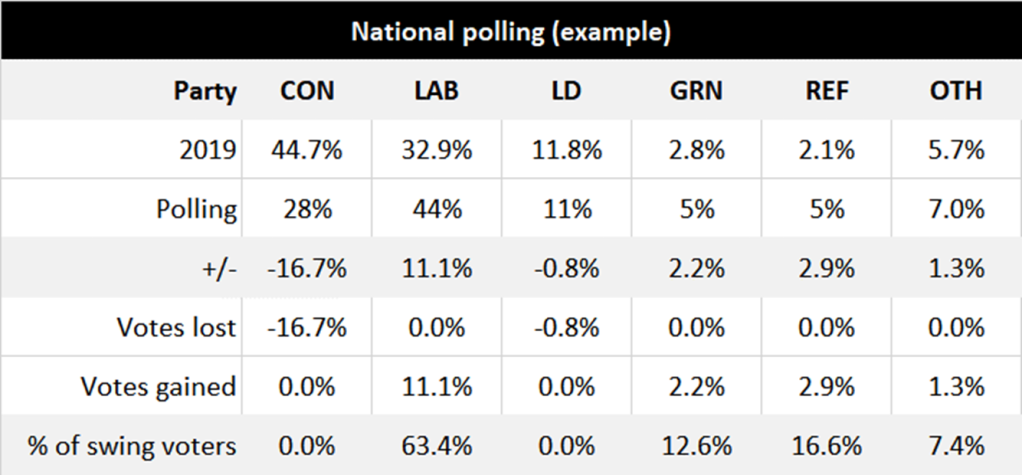
- So we have the Tories down by 16.7pts nationally, and the Lib Dems down 0.8pts. Labour, meanwhile, is up by 11.1pts. That means Labour has won 63.4% of “swing voters”, defined here as total voters who have switched from one party to another since the last election.
- Going back to Walton, we then assign 63.4% of the 1,552 swing voters to Labour, giving the party 35,522 votes – this is 87.1% of the vote, an increase of 2.4pts. We then repeat this process for all the other parties, small and large.
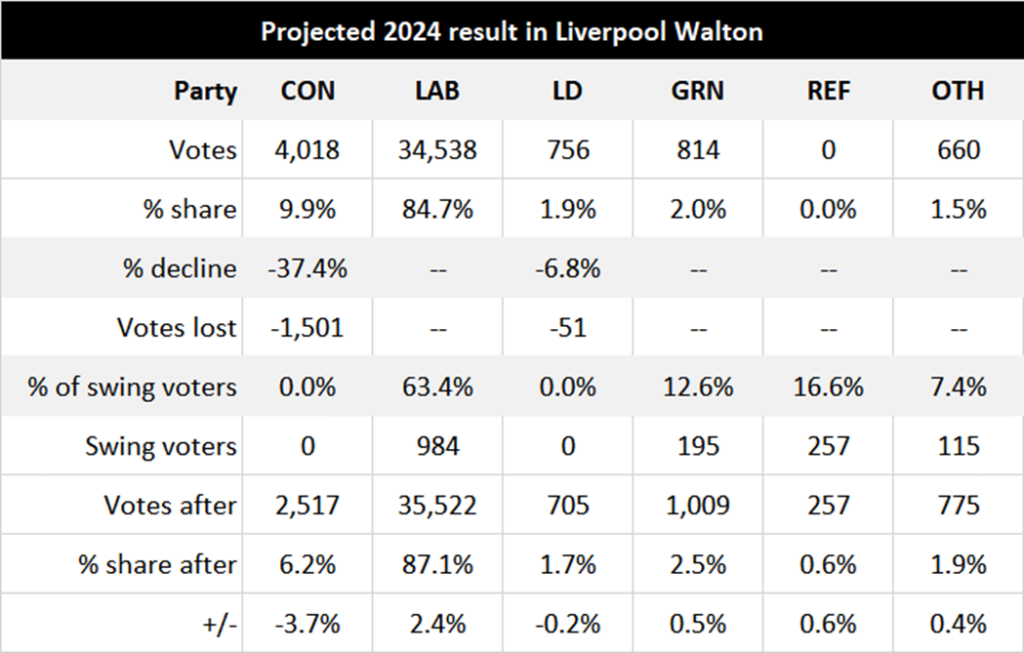
This, then, is how we take a national poll and apply it to a constituency contest in a realistic manner. Labour rose by 11.1pts nationally, but would gain just 2.4pts in Walton – because, as said before, it already had huge support and the Tories were already doing poorly. There was not very much support left for the Tories to lose.
This process is then repeated for every party in every constituency (see the attached spreadsheet to see it in action). So that is how the Transition Model works, but that’s only one part of the model.
PART 2: THE STRONG TRANSITION MODEL
In 2007, Electoral Calculus updated their Transition Model, noting that:
“Polls in October 2007 implied that the Liberal Democrats would get zero seats. This is obviously too low, although the model was behaving as expected … However, the behaviour is not satisfactory …
“We present an updated variant of the Electoral Calculus transition model which has better behaviour in the event of a steep decline in a party’s support, by acknowledging the advantage of incumbency.”
The fundamental problem they faced was that the Transition Model worked reasonably well for large parties that had wide support across the country, but ran into difficulties with small parties like the Lib Dems that were weak in most places but had enclaves where their support was huge. When support for those smaller parties declined, the model would project zero seats – which was both unrealistic and unlikely. This is what led to the creation of the Strong Transition Model.
The model separates parties’ votes into “weak” votes (all of the votes they won up to 20% of the total turnout in that seat), and “strong” votes (all their other votes). If a party won less than 20% in that seat, all of their votes are considered weak votes. It then totals up all these strong and weak votes across all constituencies, to arrive at a national “weak” vs “strong” figure.
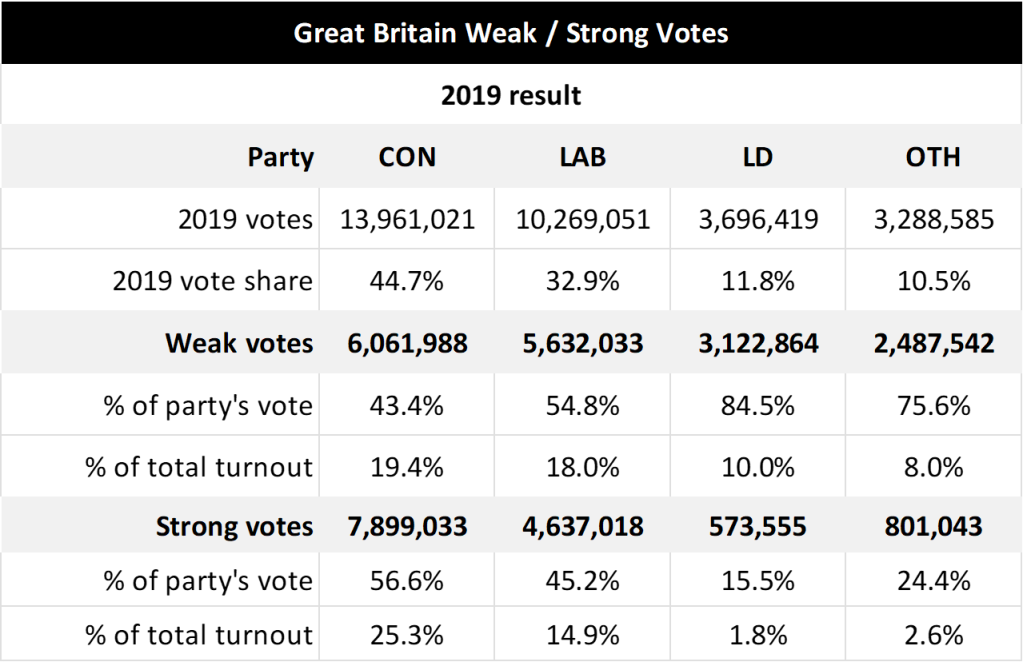
Finally, it applies the transition model to the “weak” votes first, only applying it to the “strong” votes if 100% of the weak votes are lost. This is most beneficial to small parties, who may have certain areas where they are very strong even if their national vote is small (like Lib Dems in 2017).
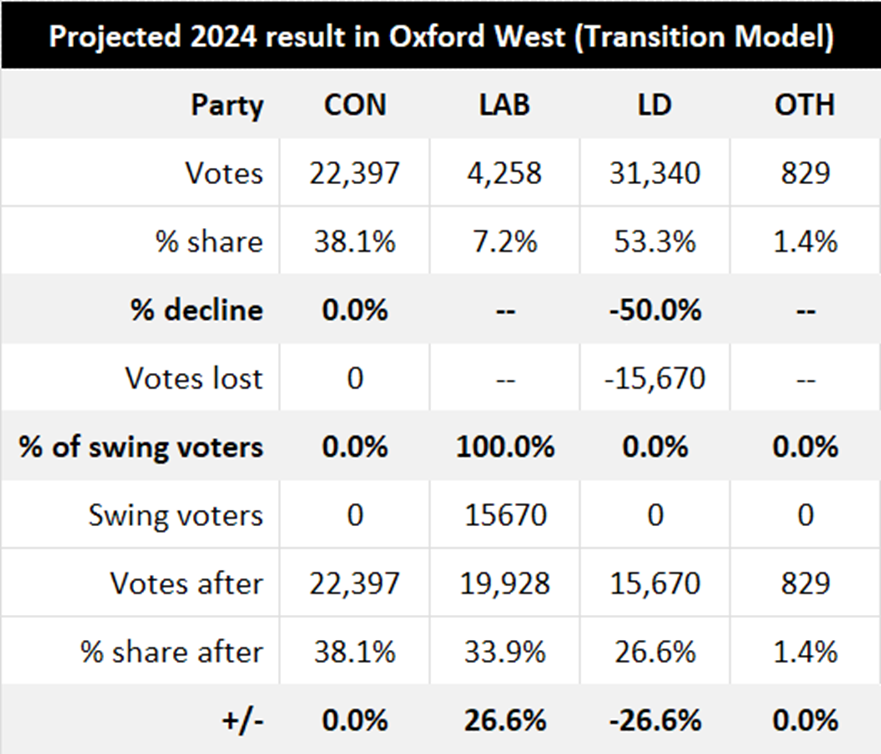
Let’s consider a hypothetical scenario in which exactly half of Lib Dem voters switch to Labour, with no other voters changing sides. Under the transition model, the Lib Dem vote would fall by a factor of 50% in every constituency, meaning they’d lose half their votes – and end with zero seats.
We can see the effect of this in Oxford West and Abingdon (home to Layla Moran MP); the Lib Dems would end up in third place, dropping to just 26.6% of the vote.
Now, let’s bring in the STRONG transition model, in which a certain portion of Lib Dem votes (up to 20% of the total turnout) in each seat are considered “strong”. The result is very different. Instead of finishing third behind Labour, the Lib Dems would WIN the seat. This is because their vote share was sizeable and very strong in December 2019, so losing ~60% of their weak votes still leaves them ahead.
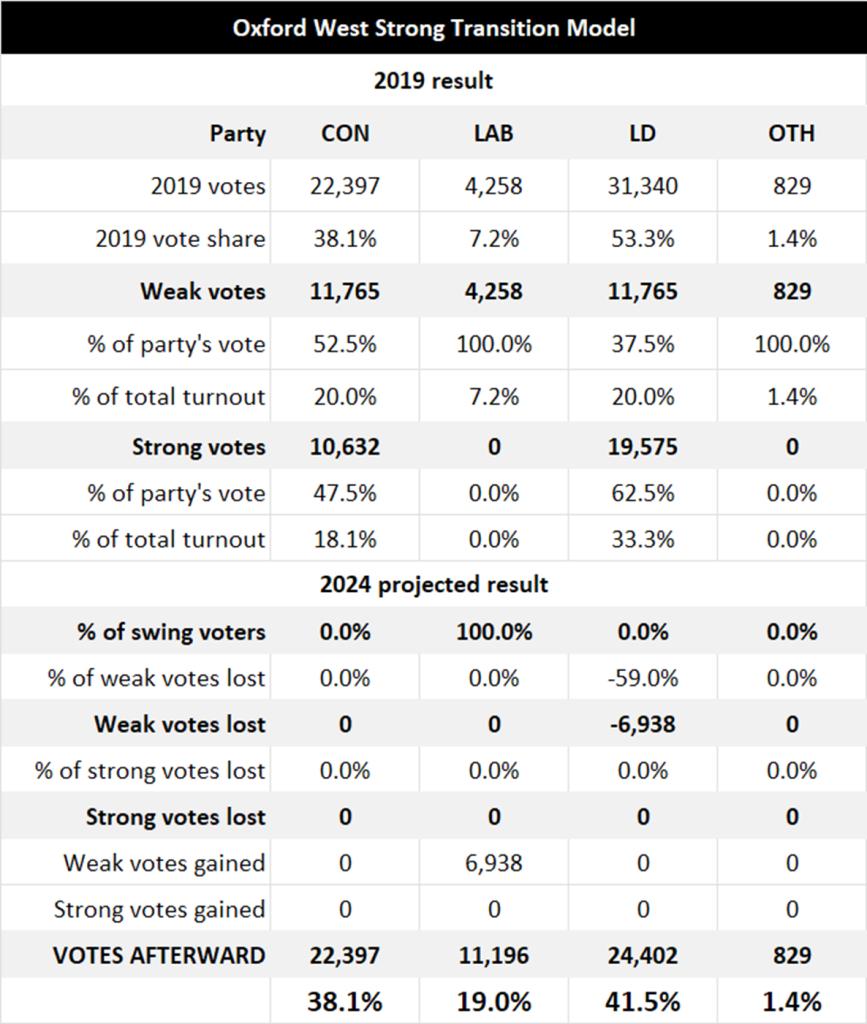
The net effect across the country would be that the Lib Dems would win 7 seats with less than 6% of the popular vote, instead of zero. And that’s how we apply the Strong Transition Model to each seat.
I make some slight alterations to this.
- In England, I use the national weak votes/strong votes ratio for the two major parties, but for the smaller political parties (LD, Grn, Reform) I use the weak/strong ratio in that constituency. I do this on the basis that the major parties do not need constituency-specific adjustments, but the smaller parties do. Other analysts may do this differently, but it works for my model and I’m confident in it.
- In Scotland and Wales, I use the weak/strong ratio in each constituency for all the parties, as they are smaller nations with a different party system (i.e. the nationalist parties).
You can read more about it here, and see it in practice in the attached spreadsheet.
PART 3: ADJUSTMENTS
Having constructed a Strong Transition Model, I then made a few adjustments of my own.
Firstly, I use the notional 2019 results for the new boundaries, as estimated by Owen Winter.
Secondly, I redistribute the second preference votes of Brexit Party voters to their second preferences, on the basis that Reform UK has a very different support base to its predecessor.
Thirdly, I split the model up by nation. Each one uses the Strong Transition Model to estimate constituency-by-constituency results, but I use separate methods to estimate the aggregate popular vote in each nation:
- In England, I estimate the English-wide vote by simply running the transition model.
- In Wales, I use a weighted average of Welsh polls (90%) and the transition model (10%).
- In Scotland, I use a weighted average of Scottish polls (90%) and the transition model (10%).
COMPARISONS
Let’s now compare the results of each model. Looking at the current average of polls, each model (UNS, Transition, Strong Transition) delivers a Labour majority – but UNS gives the Tories over 230 seats and Labour only a small majority, whereas both transition models reduce that Tory tally to around 160 seats and give Labour a landslide victory.
The difference between the Transition Model and the Strong model is also clear here – the SNP would gain 5 seats from the Conservatives under the Transition Model, but the Strong model means those seats would remain in the Conservative column as it takes account of their local strength.
CONCLUSION
If I was to summarise my model in one sentence, it would be as follows:
The model uses a proportional swing (not a uniform swing), and distributes that swing on a sliding scale based on how strong or weak each party is in each constituency.
There are several more alterations and additions, but the above sentence is the basis of the entire thing.
Before I finish, let me just credit Electoral Calculus again for their excellent Strong Transition Model, which I have used as the core of my own calculations with some additions of my own. I also want to thank Britain Elects for their model and work, which has been very useful. Credit also goes to Owen Winters for his estimates of the notional 2019 result under the new boundaries.
I hope this article has been informative; feel free to review my model, and if you notice any errors on my part, please do point them out. If there are any errors, I want to emphasise that they are my errors and not those of Electoral Calculus, whose model I have adapted.
